
Cup and Handle Pattern – Definition, How it Works, Types, Calculation, and Trading
The cup and handle pattern is one of the most recognisable formations in technical analysis, widely used by traders to anticipate bullish continuations. Whether you’re an intraday trader or a long-term investor, understanding how this pattern forms—and when it signals a breakout—can give you a valuable edge. In this guide, we’ll break down how to identify the cup and handle, explore its variations, and explain how you can apply it across different markets using the powerful charting and strategy tools available on TradeSmart.
What Does Cup and Handle in Technical Analysis Mean?
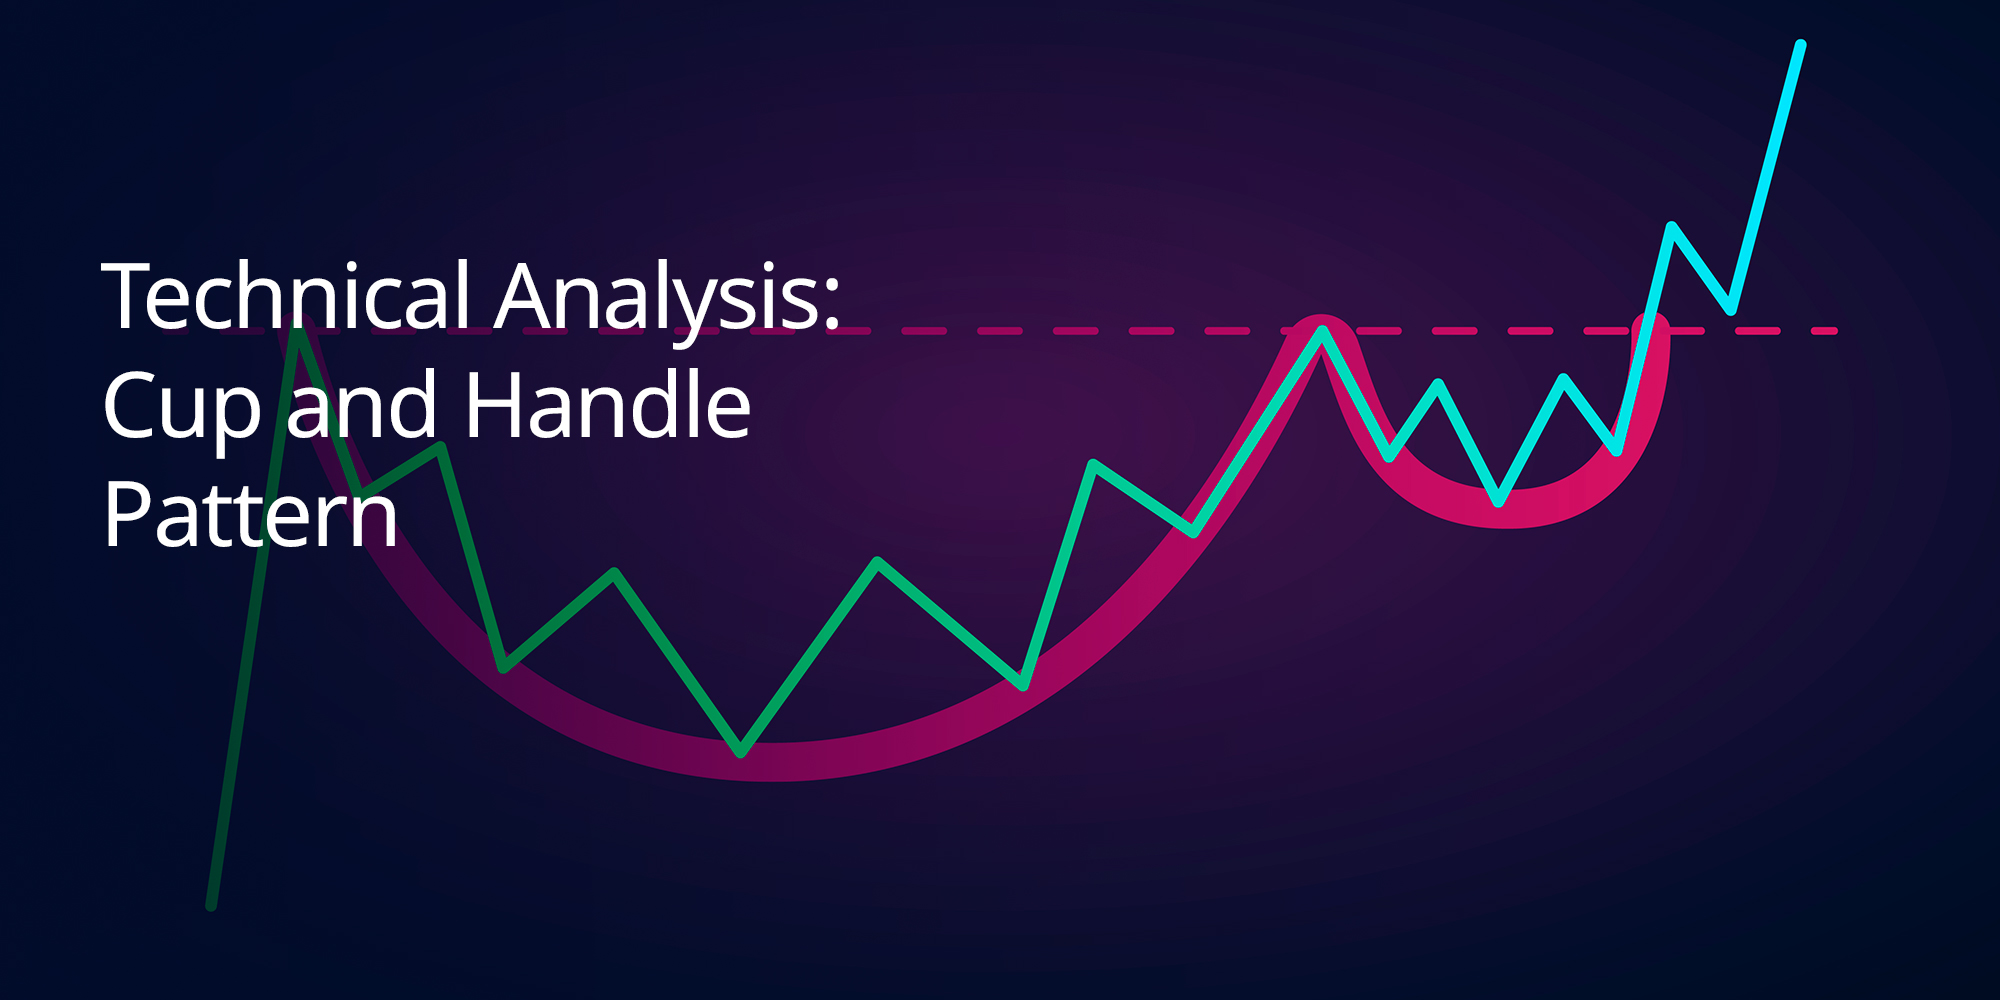
The cup and handle pattern is a bullish continuation, visually resembling a teacup with a handle. First popularised by William J. O’Neil, this formation typically signals the continuation of an upward trend once the handle completes its setup.
The “cup” element forms after a gradual price decline that eventually recovers to the original peak, creating a smooth U-shaped curve. This shape reflects a period of consolidation where the market corrects itself. Following this, the “handle” forms a minor downward drift or sideways movement representing a brief pause or slight profit-taking before momentum resumes.
How to Identify a Cup and Handle Pattern?
Spotting the cup and handle pattern requires careful attention to structure and volume on a price chart.
The first step is identifying the “cup.” This section typically forms after a downtrend, presenting a rounded bottom that curves back up to the prior high. Traders should look for the following features:
- Rounded base: The cup should curve smoothly, without sharp spikes or rapid reversals.
- Symmetry: Both sides of the cup should reflect a similar structure and timing.
- Depth: Ideally, the cup should be no deeper than one-third of the prior price range.
Once the cup forms, the next step is identifying the “handle.” This phase typically unfolds over 1 to 4 weeks and reflects a short consolidation:
- Descending channel or wedge: The handle often tilts slightly downward, though sometimes it moves sideways.
- Lower volume: Volume generally decreases during the handle, showing reduced activity.
The final and most critical phase is the breakout. This occurs when the price moves above the resistance formed by the top of the handle. To confirm the breakout:
- Spike in volume: Watch for an increase in trading volume as the breakout happens.
- Price acceleration: A sharp price rise beyond resistance confirms the pattern and suggests a potential buying opportunity.
By mastering the identification of this pattern, traders on platforms like TradeSmart can enhance their ability to spot bullish momentum and time their entries more effectively.
What are the Types of Cup and Handle Patterns?
Cup and handle formations can take various forms, depending on the overall market sentiment and structural differences in the pattern. Understanding these variations can help traders on platforms like TradeSmart refine their strategies and spot signals with more precision.
Bullish Cup and Handle
This is the most well-known version of the pattern and typically points to a bullish continuation. It begins with a smooth, rounded “cup” formed after a price pullback, followed by a modest dip or sideways move—the “handle.” A decisive breakout above the handle’s resistance, ideally accompanied by increasing volume, signals strong buying momentum.
Bearish Cup and Handle
In contrast to its bullish counterpart, the bearish cup and handle pattern suggests a potential reversal to the downside. It features an inverted “U”-shaped cup, often formed during a temporary rally within a broader downtrend. The handle emerges as a short-lived upward retracement, and once the price breaks below the support level at the bottom of the handle, it confirms bearish continuation.
Continuation Cup and Handle
Sometimes, this pattern appears mid-trend, acting as a pause before the existing momentum resumes. In a bullish trend, the cup and handle often resemble a bullish flag, while in a bearish trend, the same formation could resemble a bearish flag. These continuation setups are valuable for traders looking to ride the prevailing trend after consolidation.
Inverted Cup and Handle
Primarily seen in bearish market conditions, the inverted cup and handle mirrors the classic bullish formation—but upside down. The price forms an arched, inverted cup, followed by a slight uptick or sideways handle. A breakdown below the handle’s support confirms the pattern and signals further downside potential.
Rounded Bottom and Flat Handle
Not every handle dips. In this variation, the cup forms as usual, but the handle appears flat—running nearly horizontal. Despite the lack of a downward slope, this structure often indicates a stronger bullish breakout, as it reflects minimal retracement and tighter consolidation.
What are the Advantages of the Cup and Handle Pattern?
- Supports risk-managed trading: By clearly outlining potential entry points and breakout zones, the pattern enables traders to place stop-loss orders more effectively, helping to protect capital and manage risk.
- Signals trend continuation: It often appears as part of a bullish continuation, providing early signs that a prevailing uptrend may resume—ideal for traders looking to follow momentum.
- Reveals investor sentiment: The gradual rounding of the cup and pause during the handle reflect shifts in market psychology. Analysing this pattern offers insights into how traders are positioning themselves and when confidence is returning.
- Works across timeframes: From short-term scalping on intraday charts to long-term swing trades or investments, the cup and handle can be applied flexibly to suit a wide range of strategies.
- Clear breakout levels: The resistance formed at the top of the handle acts as a straightforward signal line—once price breaks through this level with volume, it often indicates a reliable trade opportunity.
What are the Disadvantages of the Cup and Handle Pattern?
- Subject to interpretation: There’s no one-size-fits-all template for identifying this pattern. Traders may disagree on what qualifies as a proper “cup” or “handle,” leading to inconsistent reads.
- Potential for false breakouts: The pattern’s subjective nature can produce misleading signals. Without proper confirmation, traders may act too early, only to see the price reverse shortly after entry.
- Requires experience and judgment: Successfully trading the cup and handle demands a trained eye. Beginners may confuse it with similar formations or overlook important details, increasing the risk of error.
- Takes time to form: One of the more time-consuming patterns, the cup and handle often develops slowly, sometimes over weeks or months. This can require patience and may lead to missed opportunities in faster-moving markets.
1. Cup and Odd Handle
This variation of the classic cup and handle formation features a less conventional structure—most notably within the handle. While traditional patterns show a slight downward drift, the cup and odd handle diverges from this with unique asymmetry.
- Irregular handle formation: Instead of sloping downward, the handle may tilt upward or display a jagged or uneven shape.
- Unpredictable timing: The handle may form over a much shorter or longer period than typical, adding an element of surprise to the setup.
- Greater price swings: The lack of uniformity can lead to increased volatility, suggesting more uncertainty in market sentiment.
2. Multi-Year Cup and Handle
The multi-year cup and handle is a long-term version of the pattern, often developing over several years. This extended timeframe offers valuable insights for long-term investors, especially those analysing historical price cycles of well-established assets.
- The cup typically spans one to three years, reflecting a long accumulation phase with a broad, rounded bottom.
- The handle usually takes shape over several months, indicating a brief pullback or pause before a potential breakout.
3. Intraday Cup and Handle
Short-term traders often look for opportunities within the trading day, and the intraday cup and handle is a go-to pattern for such strategies. Typically found on 5-minute or 15-minute charts, this version requires quick recognition and swift execution.
- The cup forms as a rounded bottom within minutes or hours, depending on the market’s pace.
- The handle follows as a brief pause, appearing as a downward drift or sideways movement before the breakout.
When Should You Use Cups and Handles for Trading?
The cup and handle is best used as a bullish continuation signal when certain technical conditions align. Traders turn to this pattern to identify potential buying opportunities in stocks, indices, or other securities, particularly when market sentiment suggests a continuation of upward momentum.
How to Trade Cup and Handle Pattern?
- Spot the setup: Identify the U-shaped cup and short consolidation handle.
- Confirm the breakout: Look for a breakout above resistance with volume spike.
- Plan entries and exits: Use stop-loss below the handle, project target from cup depth.
- Use confirmation tools: Use MACD, RSI, and volume indicators to verify strength.
What Is the Reversal Downtrend for the Cup and Handle Pattern?
Sometimes the cup and handle forms a rounded top and drifting handle, indicating weakening momentum. A breakdown with volume confirms trend reversal.
Conclusion
Mastering the cup and handle pattern can significantly improve trade timing. Combine it with strong confirmation tools and risk management for success on platforms like TradeSmart.